"Observability is too slow for trading systems." Challenge accepted.
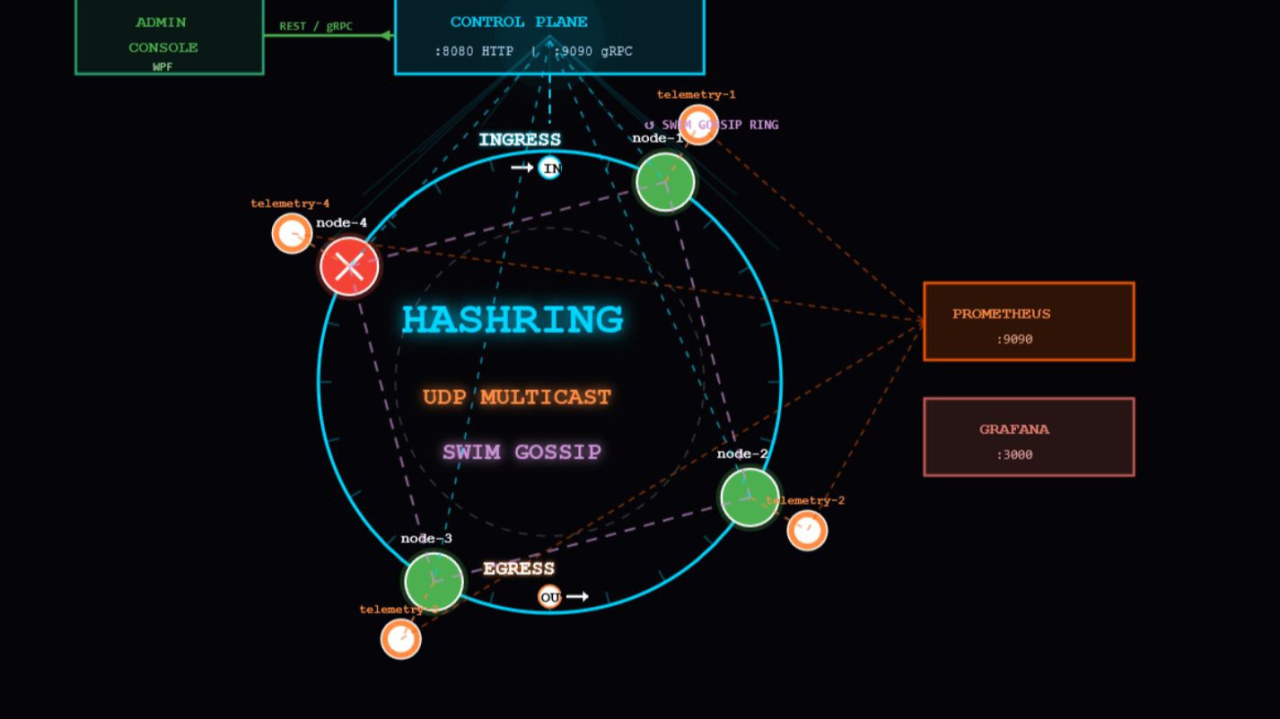
📌 This is Article 1 of my newsletter series: "Building a sub‑ms pricer with full observability – a real‑world dev log" Next articles: achieving ultra-low latency on the hot path, latency‑free metrics, auto-healing cluster, the AI in the loop, and the code release - try it yourself.
A few weeks ago, I was challenged hard. And I have to admit: I had to dust off knowledge I hadn't touched in years.
I was explaining my three non‑negotiables for any serious project I start from scratch:
- Built‑in observability: A respectable production app never waits for users to complain before taking action.
- Resiliency & autohealing: Systems should repair themselves, not just crash.
- Simplicity: Any average software developer should be able to evolve what I build.
Before I even finished listing them, my colleague, let's call him Ali, cut me off:
"Observability? You mean Grafana, ELK, all that? They're very, very slow. We build trading platforms. Not compatible."
I replied: "It depends on how you implement. Think of a football referee, they don't need to run as fast as the players. Just fast enough to witness everything."
"Pretty words. I'll believe it when I see it."
Challenge accepted.
What I'm building and why it matters
I'm building an ultra-low-latency pricing system, capable of seamless scaling, dynamic load re-balancing, and continuous computation. The system consumes streaming market data, computes prices (via stripping, interpolation, extrapolation), and publishes reformulated prices to trading apps – all in sub-millisecond time.
The demo – already running
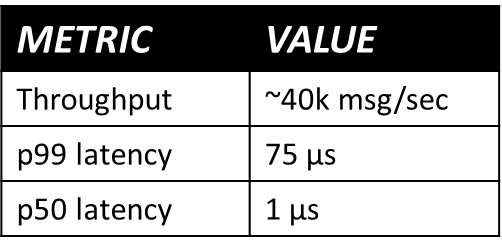
Current limit: Docker Desktop (~45k msg/sec)
Why? Docker Desktop's virtual network stack adds significant overhead for UDP multicast. On bare metal, a sendto() syscall takes ~200ns. On Docker Desktop's Hyper-V virtual switch, it's ~300µs – 1,500x slower. When multiple threads hammer the same multicast group, lock contention makes performance worse
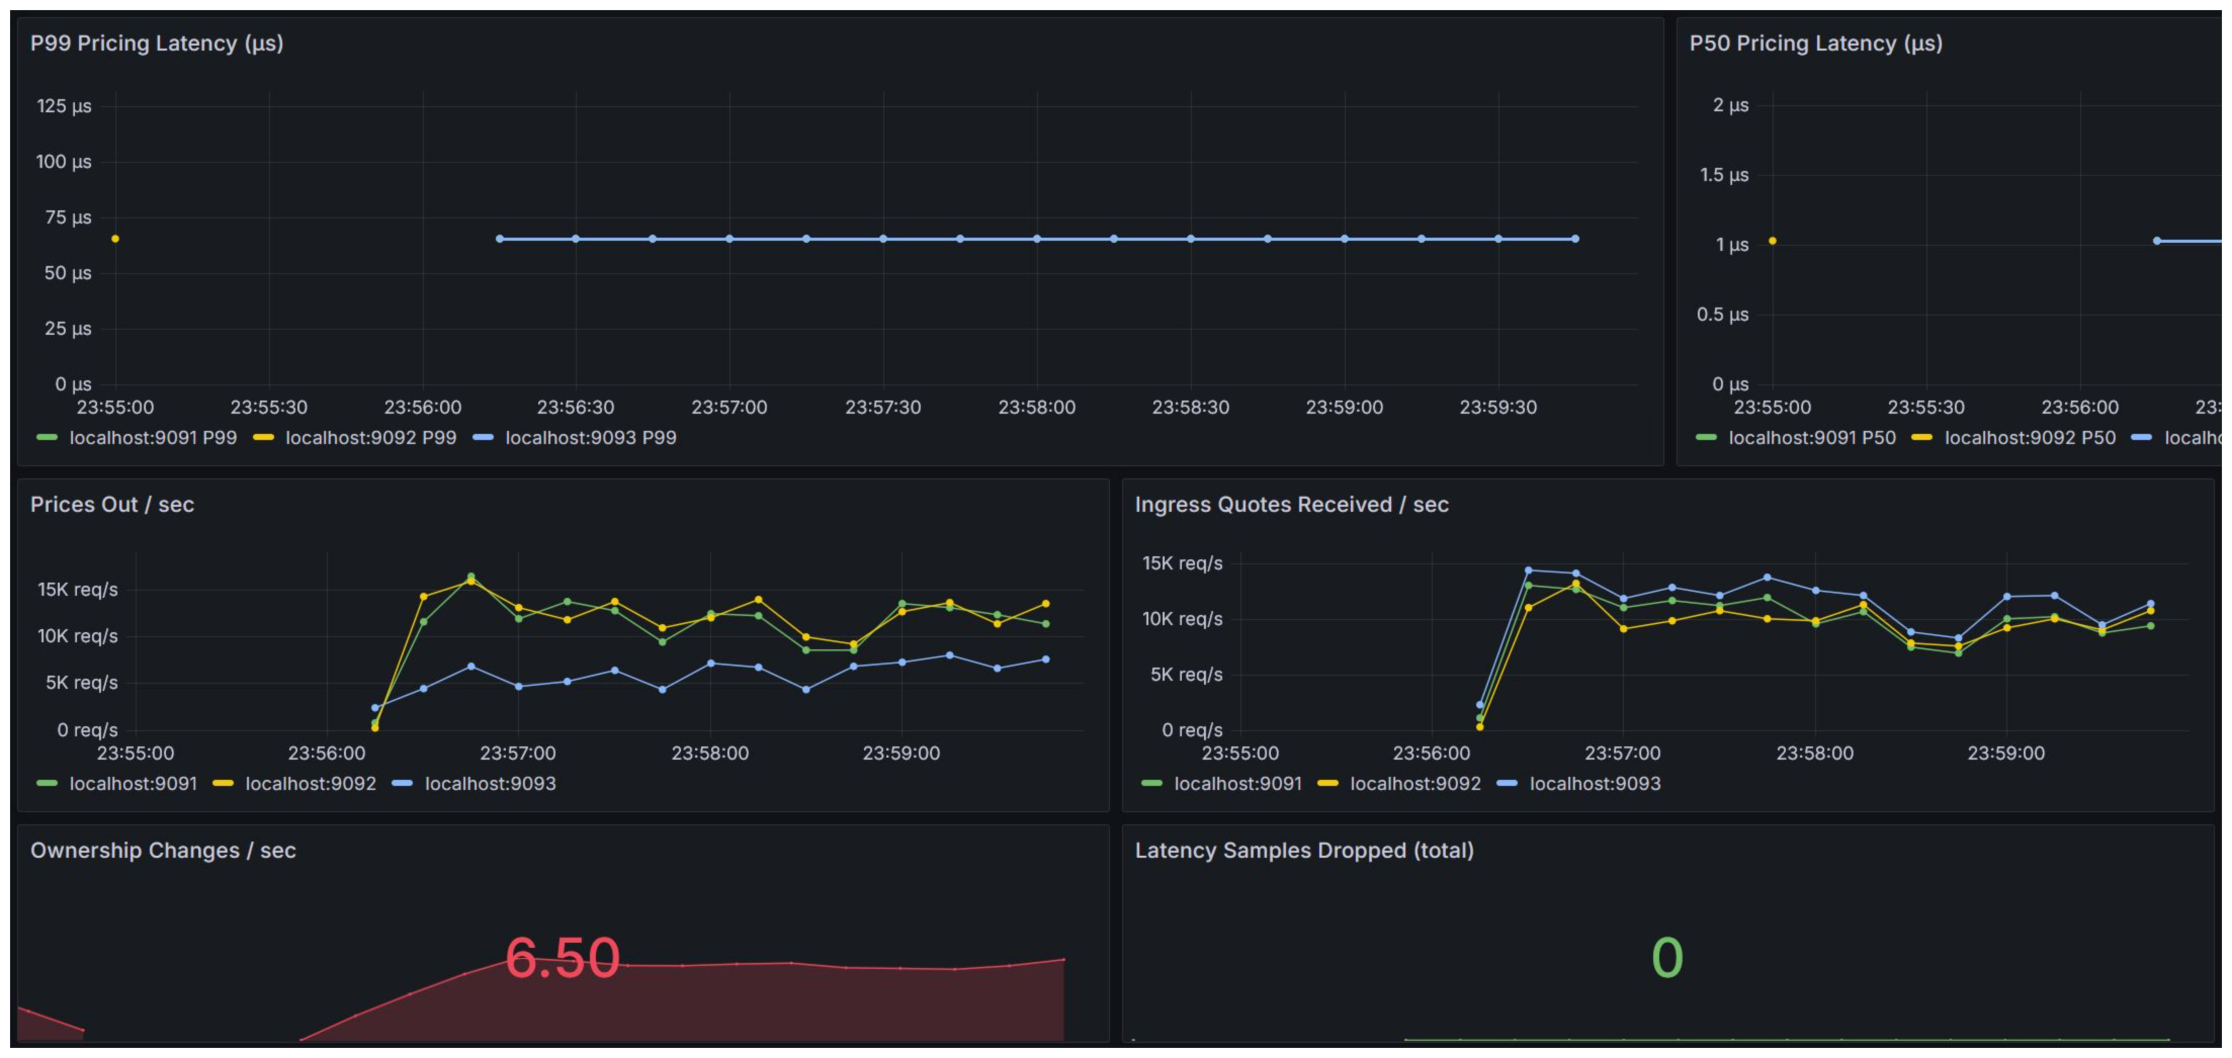
Grafana screenshot for 3 nodes
What you'll learn if you follow the series
Article 2 – Achieving ultra-low latency on the hot path Architecture, data pipeline, coding techniques, and principles (zero‑copy, CPU affinity, avoid GC pauses, ...) that get market data processed and published in well under 1ms.
Article 3 – Latency‑free metrics How to add observability without slowing the hot path: ring buffers, metrics that cost only nanoseconds overhead per event, efficiently exporting.
Article 4 – Auto‑healing cluster + AI in the loop Self‑repair via SWIM gossip, automatic node failover, and how AI sidecar can improve.
Article 5 – Code release Full source code to run your own sub‑ms pricer
Comments
Leave a comment