Article 3: Latency-free metrics – observability without slowing the hot path
📌 This is Article 3 of my newsletter series: "Building a sub-ms pricer with full observability – a real-world dev log"
In this article:
- Why traditional logging is a "suicide pact" for p99s.
- Why "We already have ELK" is a dangerous argument.
- The Process Boundary: Why shared heaps are a liability.
- The Solution: Memory-Mapped Files (MMF) + Hybrid Batching.
- Blittable Structs: The secret to 100ns telemetry.
We will see below, how most observability solutions are a trap – and how to build one that doesn't tax the hot path.
The Observability Trap
Observability is the ability to answer unknown questions about a system's state without the system even noticing that you’re looking.
The observability relies on three pillars: Metrics, Logs and Traces.
- Metrics ("How many/How fast?"): 40k msgs/sec with p99 latency of 35µs.
- Logs ("What happened?"): "Node 2 dropped AAPL - hash mismatch".
- Traces ("Where did the time go?"): Ingress (50µs) -> Pricing (200µs) -> Publisher (30µs).
Those three pillars are often implemented in a way that kills performance.
The problem is that generating these signals usually involves string formatting, heap allocations, and lock contention. In a low-latency environment, if you log like a standard web app, your p99s are toast.
Fatal Mistakes in Telemetry Design
Every application does logging. It is very common to see a line like this:
logger.InfoFormat("Node {0} processed {1} in {2}ns", nodeId, instrument, latency);When log centralization became a thing, companies invested heavily in their data lake, conscious of the importance of clean, centralized, and exploitable data. That is when the developers said: Eureka. Instead of logging to a file, let's log to ELK also. All we have to do is some configuration to redirect our data.
And now, because observability has become a topic that leadership loves, the natural question follows: We have ELK. Why not use it for everything?
That is the first mistake.
Mistake #1: Using ELK for Metrics
Let me tell you what happens next.
You configure your app to send every metric to Elastic: every latency measurement, every throughput counter, every dropped message. It works fine at 10 requests per second. The demo is a success. The team approves the architecture.
Then you go to production.
At 40k messages per second, ELK ingests everything just fine. The cluster does not collapse. No logs are dropped. The pipeline keeps up.
So where is the problem?
- Query latency. From the moment a metric lands in Elasticsearch until it becomes searchable in Kibana, tens of seconds can pass. For real‑time observability – detecting a latency spike or a dropped message within milliseconds – tens of seconds is useless. By the time you see the problem, the incident is over. The desk has already called.
- Storage cost. ELK uses full‑text indexing (Lucene). Storing as a text string 4 million times per hour is expensive. The cluster grows. The bill grows. Retention periods get cut – first from 90 days to 30, then to 14. You raise the log level. You lose historical context exactly when you need to spot a trend.
- The push model. ELK requires your application to push metrics over HTTP. That means your hot path must handle network errors, retries, and backpressure. A slow ELK node or a transient network blip becomes your latency spike. You are now trading stability for observability.
- AI-driven observability (anomaly detection, predictive scaling, root cause analysis) requires real-time, low-latency, structured metrics. If your telemetry pipeline introduces tens of seconds of delay (ELK query latency) or drops data under backpressure, the AI model is flying blind. By the time it sees a spike, the trade is already lost.
The solution is Prometheus. It uses delta‑compressed time‑series storage designed for counters and histograms, not text search. It pulls metrics from a local endpoint – your hot path never waits, never retries, never handles a failed connection. Queries return in milliseconds. Storage is efficient. The finance team stays quiet.
Use ELK for logs – it is fantastic at search, audit, and long‑term storage. Use Prometheus for real‑time metrics – it is designed for a better latency, efficiency, and pull‑based collection. They are not the same thing.
Mistake #2: Sharing the "Crash Domain" (Same Process)
Many teams think a background or separate thread is enough isolation for logging.
It isn't.
- Shared Heap: If your background telemetry thread allocates heavily, it triggers a GC. In .NET/Java, a GC pause freezes every thread in the process, including your hot path.
- Shared Fate: If your telemetry code hits an unhandled exception or an , the entire process can die.
The solution is to move telemetry to a separate process. Let it crash. Let it GC. Let it burn CPU. The hot path never knows.
Mistake #3 The traditional way of logging.
Most apps do this on the hot path:
logger.InfoFormat("Node {0} processed {1} in {2}ns", nodeId, instrument, latency);To a well informed low-latency developer, that line is a disaster. It triggers:
- String Formatting: Parsing the template and allocating a new string on the heap.
- Boxing: Converting int and long values into objects to fit the object[] params.
- Locking: Most log sinks use an internal buffer with a mutex.
- GC Pressure: At 40k msgs/sec, you are generating 40,000 short-lived objects every second, guaranteeing a Stop-the-World GC pause that will spike your p99s into the milliseconds.
This shows that the logging itself needs to be rethought.
The Velocity-Grid Solution: The "Sidecar" Pattern
Move telemetry out of the hot path. The hot path writes to a memory‑mapped file (MMF) – just a block of shared memory – and moves on. No waiting, no system calls.
A separate process called the Exposer reads that same memory and does the heavy work: formatting logs, pushing to ELK, and exposing for Prometheus.
The Memory-Mapped File (MMF) is essentially a mapping of a file’s address space (on disk) into the virtual address space of a process. Once mapped, the file’s contents are accessed exactly like a pointer-indexed array in RAM.
In traditional I/O (e.g., or ), you are making a System Call. This triggers a Context Switch: the CPU must save the state of your application, switch to Kernel Mode, copy the data from your "User Space" buffer into "Kernel Space," and then switch back. This takes ~1,000 to 3,000 nanoseconds - an eternity on a hot path.
MMF bypasses the Syscall Tax via:
- Zero-Copy Shared Memory: Both processes map the same physical RAM pages into their virtual address spaces. Writing data isn't "sending", it is a standard memory operation (an assembly MOV).
- Asynchronous Persistence: The OS manages disk I/O lazily (Page Flushing) in the background. Your hot path treats the file as raw RAM and never waits for the disk controller to acknowledge the write.
1. The Zero-Copy Handshake (MMF)
The hot path writes a blittable binary struct directly into a Memory-Mapped File. No strings, no heap, no locks.
[StructLayout(LayoutKind.Sequential, Pack = 1)]
public unsafe struct LogEntry {
    public long Timestamp; // Stopwatch.GetTimestamp()
    public int NodeId;
    public fixed byte InstrumentId[32]; // Binary fixed-buffer
    public int LatencyNs;
    public byte EventType;
}

// 1. Get ref to next slot in MMF (Atomic increment)
ref var entry = ref _mmfView[Interlocked.Increment(ref _tail) % _bufferSize];

// 2. Blit data (~100ns)
entry.Timestamp = Stopwatch.GetTimestamp();
entry.LatencyNs = currentLatency;

// 3. Batched Signaling
// We only signal the kernel every 100 messages to save the ~500ns syscall tax.
if (_tail % 100 == 0) _writeHandle.Set();
2. Hybrid Wait Strategy (The Exposer)
To keep the Hot Path lean, the Exposer (the reader process) uses a "First to Happen" logic. It waits on the handle but with a tight timeout to ensure no data gets "stale" during low-traffic periods.
- On Signal: Wake up immediately because a large batch is ready.
- On Timeout: Wake up anyway (every 100ms) to drain any remaining single messages.
while (_running)
{
    // Wake on signal OR 100ms jitter buffer
    _writeHandle.WaitOne(100);

    var entries = ReadNewEntriesFromMmf();
    ProcessEntries(entries);
}
Now we can do the following as we are no longer on the Hot Path
private void ProcessEntries(LogEntry[] entries)
{
    foreach (var entry in entries)
    {
        string instrument = DecodeInstrumentId(entry.InstrumentId);
        string logMessage = $"Node {entry.NodeId} processed {instrument} in {entry.LatencyNs}ns";
        logger.InfoFormat(logMessage);

        RecordMetrics(entry);
    }
}
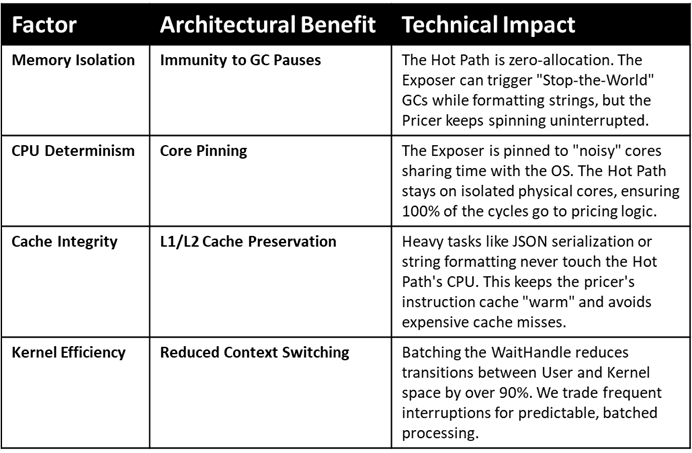
3. Why the separate process?
Running the Exposer separately isn't just about crashes; it's about Micro-Architectural Isolation.
Summary
We don't ignore the company’s existing ELK cluster; we simply refuse to let it tax the hot path. By moving telemetry across a process boundary, we achieve full observability without sacrificing a single microsecond of execution.
- The Hot Path: Blits a binary struct to MMF (~100ns) and moves on. No allocations, no strings, no waiting.
- The Exposer: A dedicated "sidecar" process that handles the heavy lifting: formatting logs, exposing metrics, and pushing to ELK.
- The Telemetry Stack: Prometheus provides the real-time heartbeat; ELK provides the deep-dive audit trail.
The lesson is simple: in a sub‑ms system, observability cannot be an afterthought. It must be designed from the ground up – zero allocation, zero blocking, zero compromise. Velocity‑Grid's MMF + sidecar pattern is one way to get there.
Comments
Leave a comment