Article 2: Achieving ultra‑low latency on the hot path
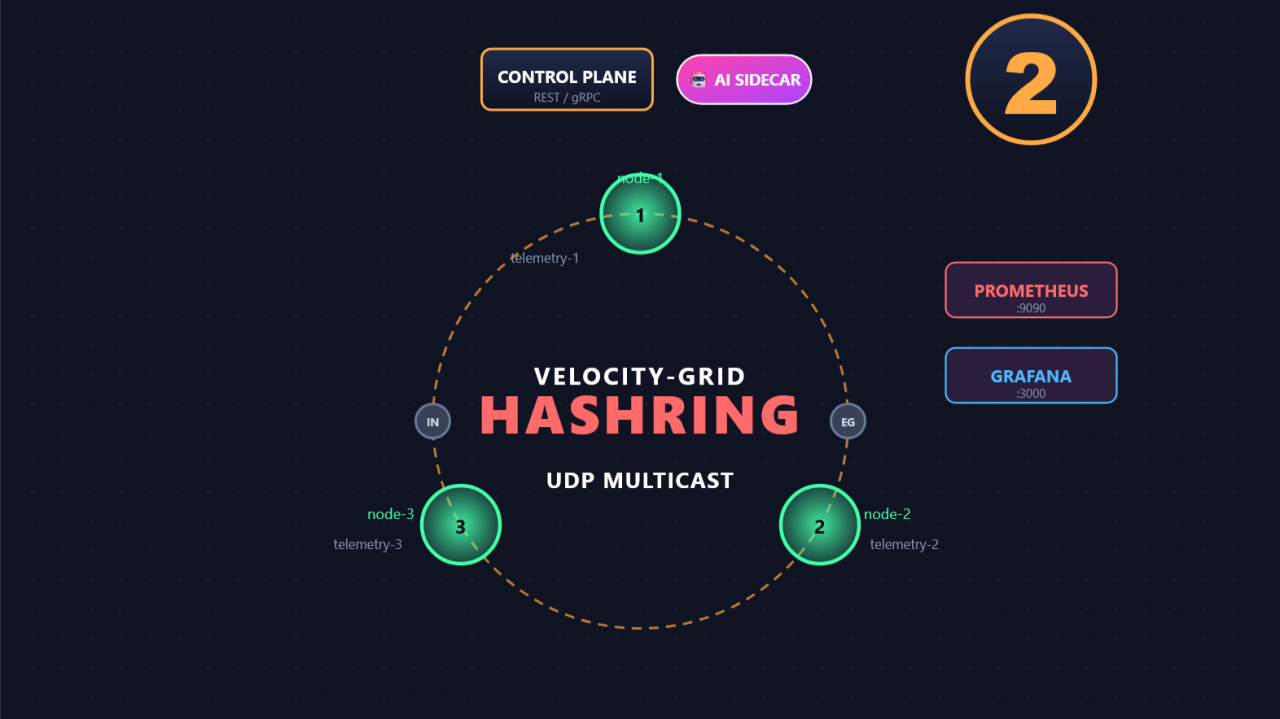
📌 This is Article 2 of my newsletter series: Building a sub‑ms pricer with full observability – a real‑world dev log. If you missed it, check out Article 1 on the core challenge.
When building an ultra-low latency pricing engine, the hardest work happens before your business logic even touches a message. Every microsecond spent parsing an irrelevant packet, context-switching, or waiting on the garbage collector is a microsecond stolen from your trading edge.
In this log, we are diving deep into the architecture of Velocity-Grid (the name II gave to this project): a high-throughput, sub-millisecond pricing engine. While the implementation code here is written in C#, the architectural concepts and low-level mechanical sympathy apply to any object-oriented language targeting bare metal.
The Architecture: Line-Rate Filtering via Consistent Hashing
At scale, Velocity-Grid processes a massive firehose of market data. Every market data message is broadcast via UDP multicast to all processing nodes simultaneously.
If every node had to fully parse every message just to decide whether it cared about the instrument, the system would collapse under the weight of serialization overhead. Instead, we use a line-rate Consistent Hash Ring to make split-second routing decisions.
How the Hash Ring Routes Data
Imagine a circle with 264 possible positions. Each physical node in our cluster owns a set of virtual positions distributed evenly around this ring.
- The Deluge Arrives: A UDP packet hits the network interface.
- Zero-Copy Hashing: The node extracts the raw bytes of the instrument ID (e.g., "AAPL") and passes them immediately to XXHASH64, a blazing-fast, non-cryptographic hash function.
- The 50ns Decision: If the resulting hash maps to a position on the ring owned by the node, it is passed to the execution path. If not, the message is instantly dropped.
ReadOnlySpan<byte> instrumentIdBytes = ...; // Raw UTF‑8 from the wire
ulong hash = XXH64(instrumentIdBytes);      // ~50ns for a 10-byte ticker
long ringPos = (long)(hash % ringSize);

if (!_ownershipMap.ContainsKey(ringPos))
    return; // Not owned. Dropped early in ~50-100ns.

Process(message);
By dropping unowned traffic within 100 nanoseconds - without allocating a single object or parsing a single field - we protect our hot path from noise. For fault tolerance, we introduce a Replication Factor (K). If K=2, both the primary node and its clockwise neighbor process the message, but only the primary actively publishes the calculated price.
7 Mechanical Optimizations for Sub-Millisecond P99s
Protecting the hot path from unowned data is only half the battle. Once a message is accepted by a node, it must clear the pricing grid with deterministic speed.
Here are the seven low-level optimizations that take Velocity-Grid from "fast" to "predictably sub-millisecond."
1. Native AOT Compilation (Eliminating JIT Spikes)
Managed languages rely on Just-In-Time (JIT) compilation, translating intermediate code into machine code at runtime. This introduces the infamous "warm-up" period where early messages trigger massive latency spikes.
By compilation via Native AOT, we compile the C# code directly into a platform-specific native binary ahead of time.
- The Gain: No JIT warm-up threads stealing CPU cycles. The very first message processed runs exactly as fast as the millionth message.
- The Trade-Off: We lose runtime code generation (like Reflection.Emit), which we don't use on the hot path anyway. We sacrifice a sliver of peak throughput for absolute P99 predictability.
2. Zero-Copy with Span<T>
Traditionally, reading a packet requires copying bytes out of the network buffer and into a managed array before parsing. That means two allocations and two memory copies per message.
Velocity-Grid uses Span<byte> to point directly into the raw network receive buffer.
// BEFORE: High allocations, double copying
byte[] copy = new byte[length];
Buffer.BlockCopy(rawBuffer, 0, copy, 0, length);
Parse(copy);

// AFTER: Zero-copy, zero-allocation
Span<byte> span = rawBuffer.AsSpan(0, length);
Parse(span);   // Slicing and reading memory directly
The Gain: We save ~100ns per message. At a modest 40,000 messages per second, that keeps 4 milliseconds of CPU time per second inside your application instead of burning it on memory copies. As a bonus, modern compilers completely elide array bounds checks when iterating over a Span<T> in Release mode.
3. Zero-GC on the Hot Path
The Garbage Collector (GC) is the mortal enemy of low latency. A single "Stop-the-World" collection can pause an application for 1 to 30+ milliseconds, completely blowing past our sub-millisecond budget.
We achieve a Zero-GC hot path by adhering to strict memory constraints:
- Every data type on the execution path is a stack-allocated struct (value type).
- Managed arrays are replaced with pre-allocated native memory (NativeMemory.Alloc) or leased via ArrayPool<byte>.Shared.
- No string manipulation. We parse and compare tickers using raw UTF-8 spans.
- Reallocating collections like List<T> or Dictionary<K,V> are banned; we use fixed-size, pre-allocated buffers.
The Gain: The GC never triggers because it sees nothing to collect. Our P99 latency drops from 5ms down to a clean 75µs.
4. CPU Affinity (Pinning Threads)
By default, the operating system's thread scheduler freely moves execution threads across different CPU cores to balance heat and load. Every time your thread hops to a new core, its L1 and L2 data caches are left behind, costing 10 to 50 microseconds to rebuild.
We pin our critical execution threads to dedicated, isolated CPU cores:
// Pin the current execution thread tightly to Core 2
Thread.CurrentThread.SetAffinity(new IntPtr(2));
The Gain: Jitter caused by cache-eviction and context switching vanishes entirely.
5. Padding Fields to Avoid False Sharing
Modern CPUs read and write memory in 64-byte chunks called cache lines. If two different threads on two different cores are writing to two independent fields that happen to reside within the same 64-byte window, the CPU forces them to bounce ownership of that memory cache back and forth. This is false sharing.
To prevent this hardware stall, we explicitly pad our high-frequency counters to ensure they occupy their own distinct cache lines:
[StructLayout(LayoutKind.Explicit, Size = 64)]
struct PaddedCounter
{
    [FieldOffset(0)] public long Value; // The actual counter
    // The remaining 56 bytes act as a hardware shield
}
The Gain: Prevents a 100–200ns penalty per write, ensuring lock-free ring buffers scale smoothly across multiple cores.
6. Atomic Spinlocks over Kernel Locks
Using standard OS primitives like lock or Monitor forces a thread into a waiting state controlled by the operating system kernel. This context switch costs anywhere from 500ns to several microseconds.
For critical sections that only take a handful of nanoseconds to execute, we drop kernel locks entirely and use lightweight, atomic CPU instructions:
// Replaced: lock(_mutex) { count++; }
Interlocked.Increment(ref count); // Atomic, hardware-level instruction
The Gain: Lock overhead drops from 500ns down to an atomic 50ns.
7. Eliminating Hidden Allocations (No LINQ)
Language features like LINQ in .NET make code incredibly elegant, but they hide a massive trail of allocation bodies in their wake. A simple .Where().Take() query allocates iterator objects, state machines, and closures behind the scenes.
We roll back to explicit, predictable imperative loops:
// LINQ: Allocates an iterator, a delegate, and a fresh heap array
var result = prices.Where(p => p.Value > 1000).Take(10).ToArray();
// MANUAL: Zero allocation using ReadOnlySpan<T>
// use Span<T> + stackalloc if "prices" is not an array
ReadOnlySpan<Price> priceSpan = prices.AsSpan();
int count = 0;
for (int i = 0; i < priceSpan.Length && count < 10; i++)
{
if (priceSpan[i].Value > 1000)
{
ProcessSinglePrice(priceSpan[i]); // Direct execution
count++;
}
}The Gain: Eliminates ~200ns of invocation overhead and ensures zero garbage collection telemetry.
The Payoff: Microseconds Under Load
When you stack these optimizations together with my new setup, the compounding returns radically shift the performance profile of the grid:
Higher ingress (~280k messages/s)
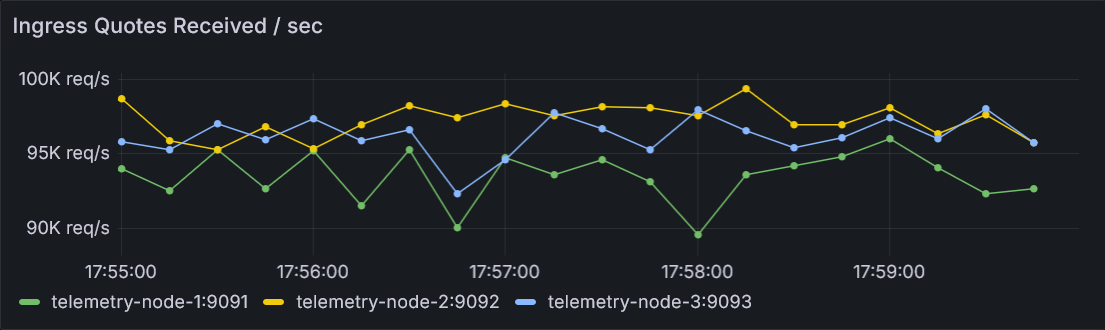
2. Grafana Ingress view
Blasting performance: p50 < 0.8 micro-seconds
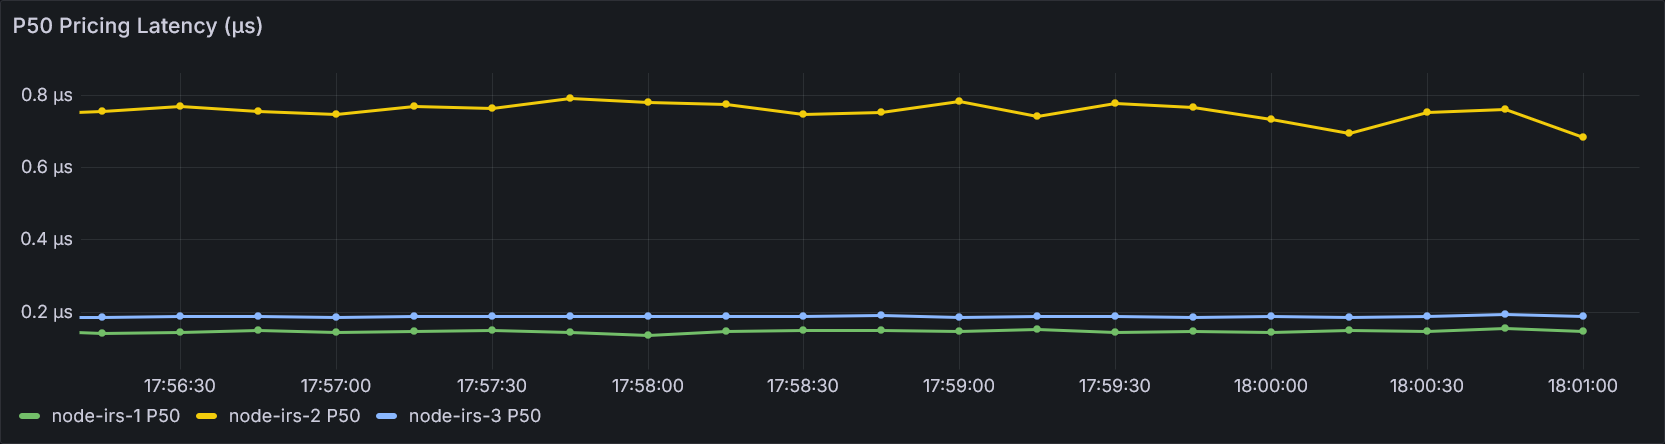
3. Grafana p50 view
Blasting performance: p99 ~ 8 micro-seconds
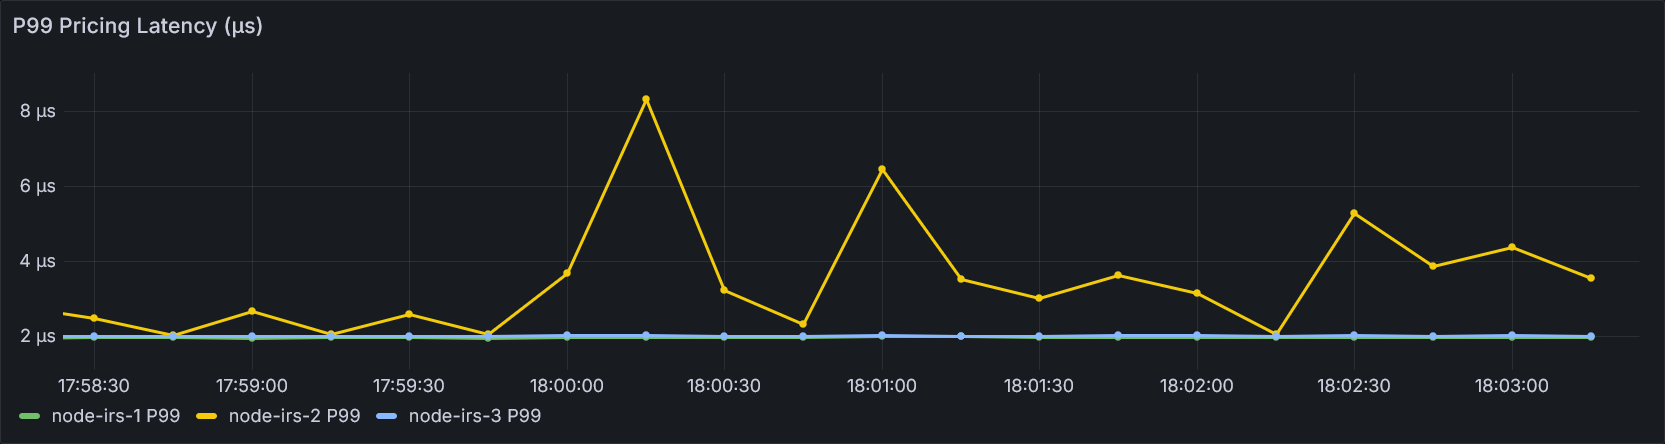
4. Grafana p99 view
Architecture
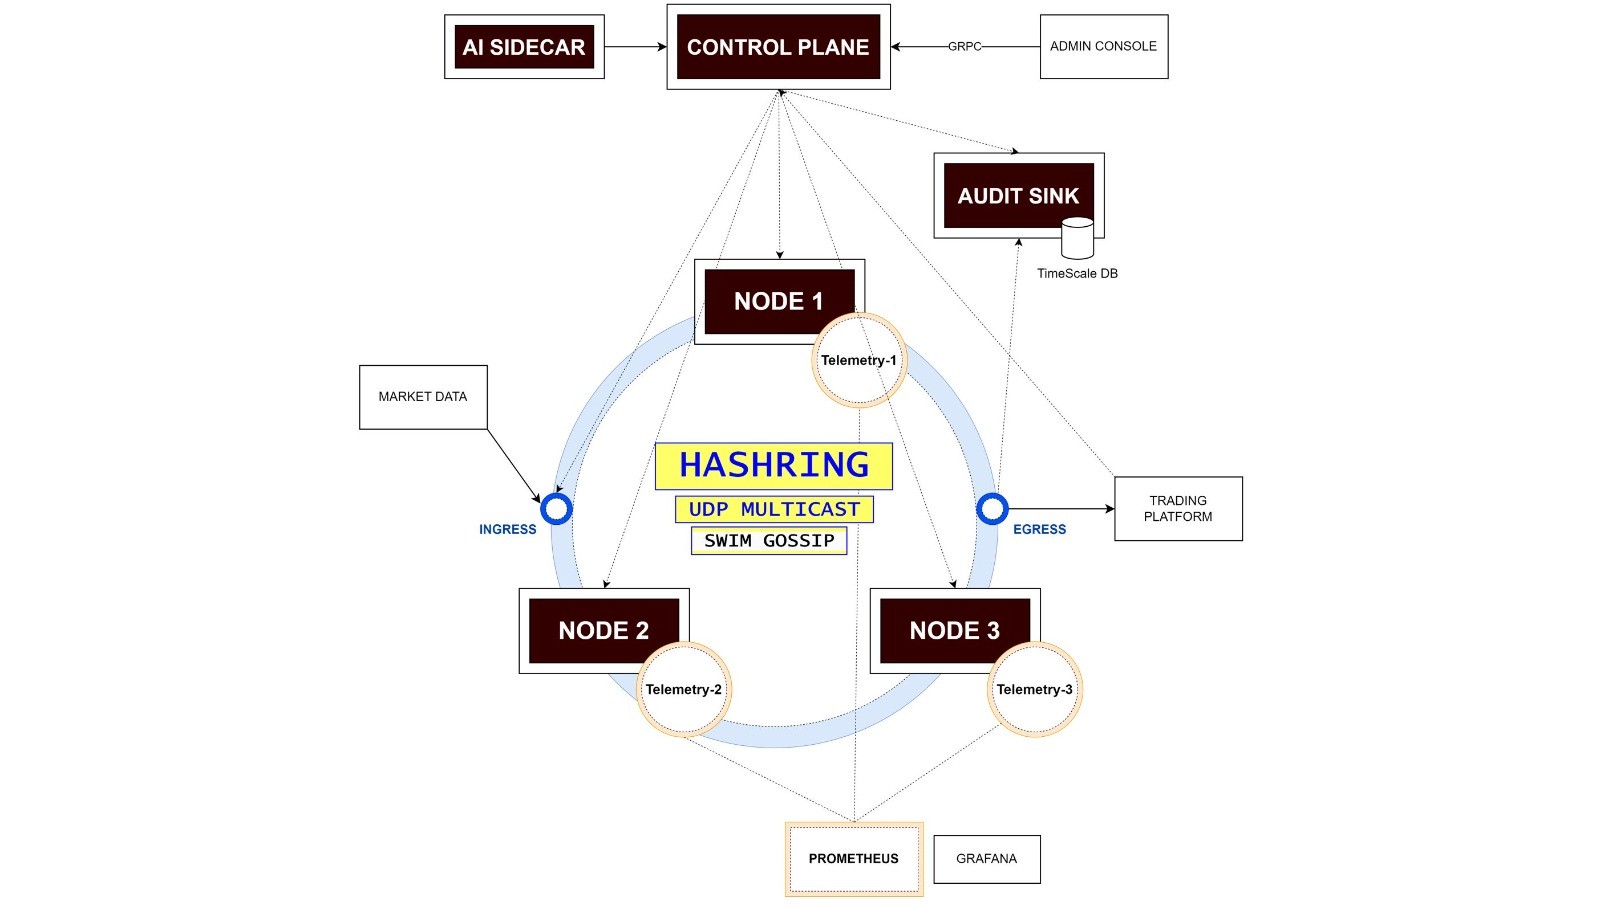
5. Architecture diagram
Comments
Leave a comment