From zero to Pro-level monitoring in less than 1H
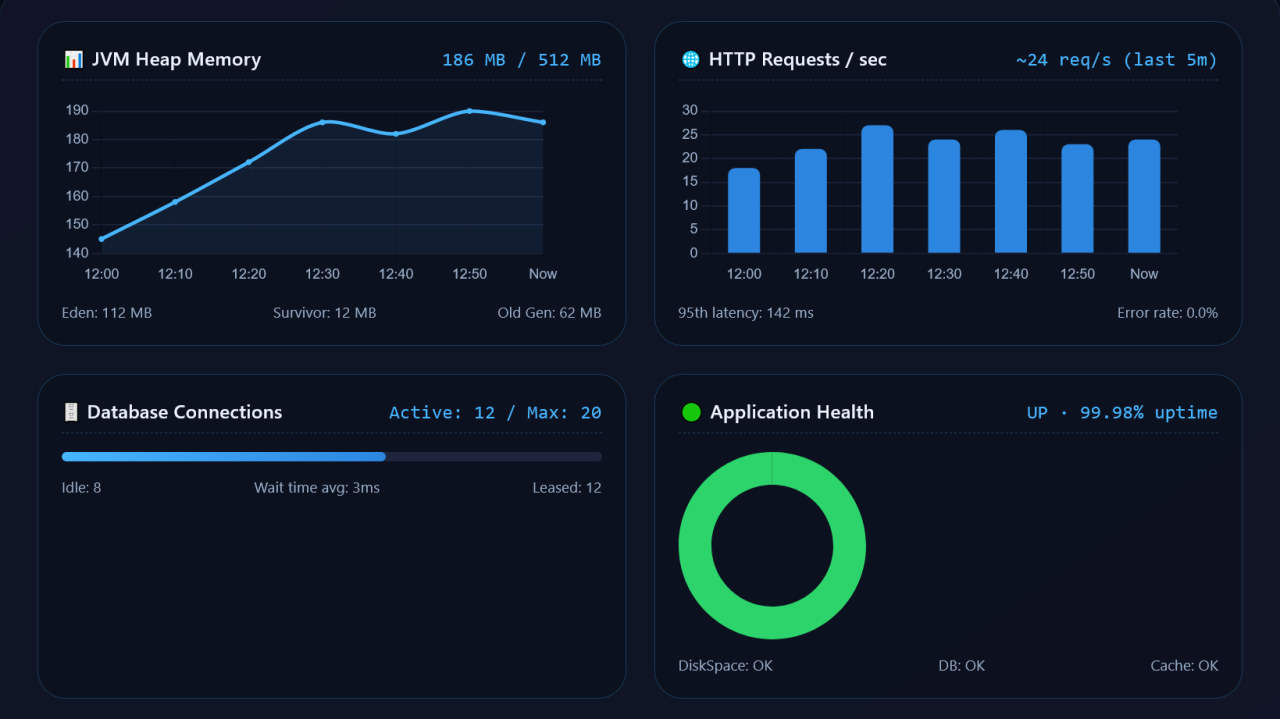
Recently, I’ve gained a lot of interest in Java Spring Boot. My background is mainly C# and Microsoft technologies, but the last time I wrote Java was a decade ago. I decided it was time to dust off those skills and see what the ecosystem looks like today. The best way for a developer to learn is to practice, so I decided to implement an end‑to‑end project.
What surprised me most was how seamlessly I could add production‑grade monitoring. Within an hour, I had a fully observable application: JVM metrics, HTTP request rates, database pool usage, all flowing into a beautiful Grafana dashboard. No endless config files, no custom instrumentation code. Just a few dependencies and a single Docker Compose file.
If you’re coming from another ecosystem or if you’ve been using Spring Boot but never set up proper observability, this guide is for you. Let’s walk through how to go from zero to pro‑level monitoring in under one hour.
💡 Want to see the result in under 5 minutes?
I’ve prepared a ready‑to‑run fork of PetClinic with everything already configured: Prometheus, Grafana, the dashboard, ... The only prerequisite you need is Docker Desktop.
Run the three command lines below. Then open http://localhost:8080 to play around with the app, and http://localhost:3000 (admin/admin) to explore the monitoring dashboard.
git clone https://github.com/lans-untout/spring-petclinic.git
cd spring-petclinic
docker compose up --build -d
Once you’ve seen the magic, read on to learn how to build it step by step.
1. Get the Baseline App Running
First, clone the PetClinic repository and start it locally – no monitoring yet. This gives us a working baseline.
git clone https://github.com/spring-projects/spring-petclinic.git
cd spring-petclinic
./mvnw spring-boot:build-info
./mvnw spring-boot:run
Visit http://localhost:8080 to see the familiar PetClinic UI. All good!
2. Add Prometheus Metrics to PetClinic
Spring Boot makes instrumentation trivial. We need two additions: the Micrometer Prometheus registry and a few lines of configuration.
In pom.xml, add the following dependency inside <dependencies>:
<dependency>
    <groupId>io.micrometer</groupId>
    <artifactId>micrometer-registry-prometheus</artifactId>
</dependency>
Now, tell Spring Boot to expose the Prometheus metrics endpoint. Open src/main/resources/application.properties and append:
# if this already exists: management.endpoints.web.exposure.include=*
# then only the last line will be required
management.endpoints.web.exposure.include=health,info,prometheus
management.metrics.tags.application=petclinic
The first line makes the /actuator/prometheus endpoint available; the second tags every metric with your application name – essential when you have multiple services.
Rebuild the app and restart it:
./mvnw clean package
./mvnw spring-boot:run
Now open http://localhost:8080/actuator/prometheus. You’ll see a wall of text: JVM memory, HTTP request counts, database connection pools – all automatically instrumented by Micrometer. No extra code required.
3. Run Prometheus, Grafana and PetClinic with Docker
We’ll run Prometheus and Grafana as containers, leaving PetClinic on the host for now (we’ll move it into Docker later). This demonstrates the classic pattern: Prometheus scrapes the app’s metrics endpoint.
Create a prometheus.yml file in the project root. Because our app runs on the host, we use the special DNS name host.docker.internal to let the container reach the host’s
global:
  scrape_interval: 5s

scrape_configs:
  - job_name: 'petclinic'
    metrics_path: '/actuator/prometheus'
    static_configs:
      - targets: ['host.docker.internal:8080']
Now create a docker-compose.yml to start all three Prometheus, Grafana and PetClinic.
Create the two files : docker-compose.yml and Dockerfile
# docker-compose.yml
services:
  petclinic:
    build: .
    container_name: petclinic
    ports:
      - "8080:8080"
    healthcheck:
      test: ["CMD", "curl", "-f", "http://localhost:8080/actuator/health"]
      interval: 10s
      timeout: 5s
      retries: 5

  prometheus:
    image: prom/prometheus:latest
    container_name: prometheus
    volumes:
      - ./prometheus.yml:/etc/prometheus/prometheus.yml
    ports:
      - "9090:9090"
    depends_on:
      - petclinic

  grafana:
    image: grafana/grafana:latest
    container_name: grafana
    ports:
      - "3000:3000"
    environment:
      - GF_SECURITY_ADMIN_PASSWORD=admin
    depends_on:
      - prometheus
# Dockerfile (file with no extension)
# Use an official Maven image with JDK 17 to build the app
FROM maven:3.9-eclipse-temurin-17 AS builder
WORKDIR /app
COPY pom.xml .
COPY src ./src
COPY prometheus.yml .
# Run the package phase without tests (optional)
RUN mvn clean package -DskipTests
# Use a lightweight JRE image to run the app
FROM eclipse-temurin:17-jre-alpine
WORKDIR /app
# Copy the built JAR from the builder stage
COPY --from=builder /app/target/spring-petclinic-*.jar ./petclinic.jar
EXPOSE 8080
ENTRYPOINT ["java", "-jar", "petclinic.jar"]This multi‑stage build compiles the application inside a Maven container, then copies the resulting JAR into a lightweight JRE container.
You can now run everything
docker-compose up -dAfter a minute or so, all three containers will be running. Verify:
- PetClinic UI: http://localhost:8080
- Prometheus targets: http://localhost:9090/targets
- Grafana: http://localhost:3000 (login: admin, pwd: admin)
4. Now Import a Professional Dashboard
Grafana’s community has already built a fantastic dashboard for Spring Boot (ID 4701). Let’s import it.
- In Grafana, go to Connections > Data Sources and add a Prometheus data source with URL http://prometheus:9090. Click Save & Test.
- Click the + icon (left sidebar) > Import. Enter 4701 and click Load.
- Select your Prometheus data source from the dropdown and click Import.
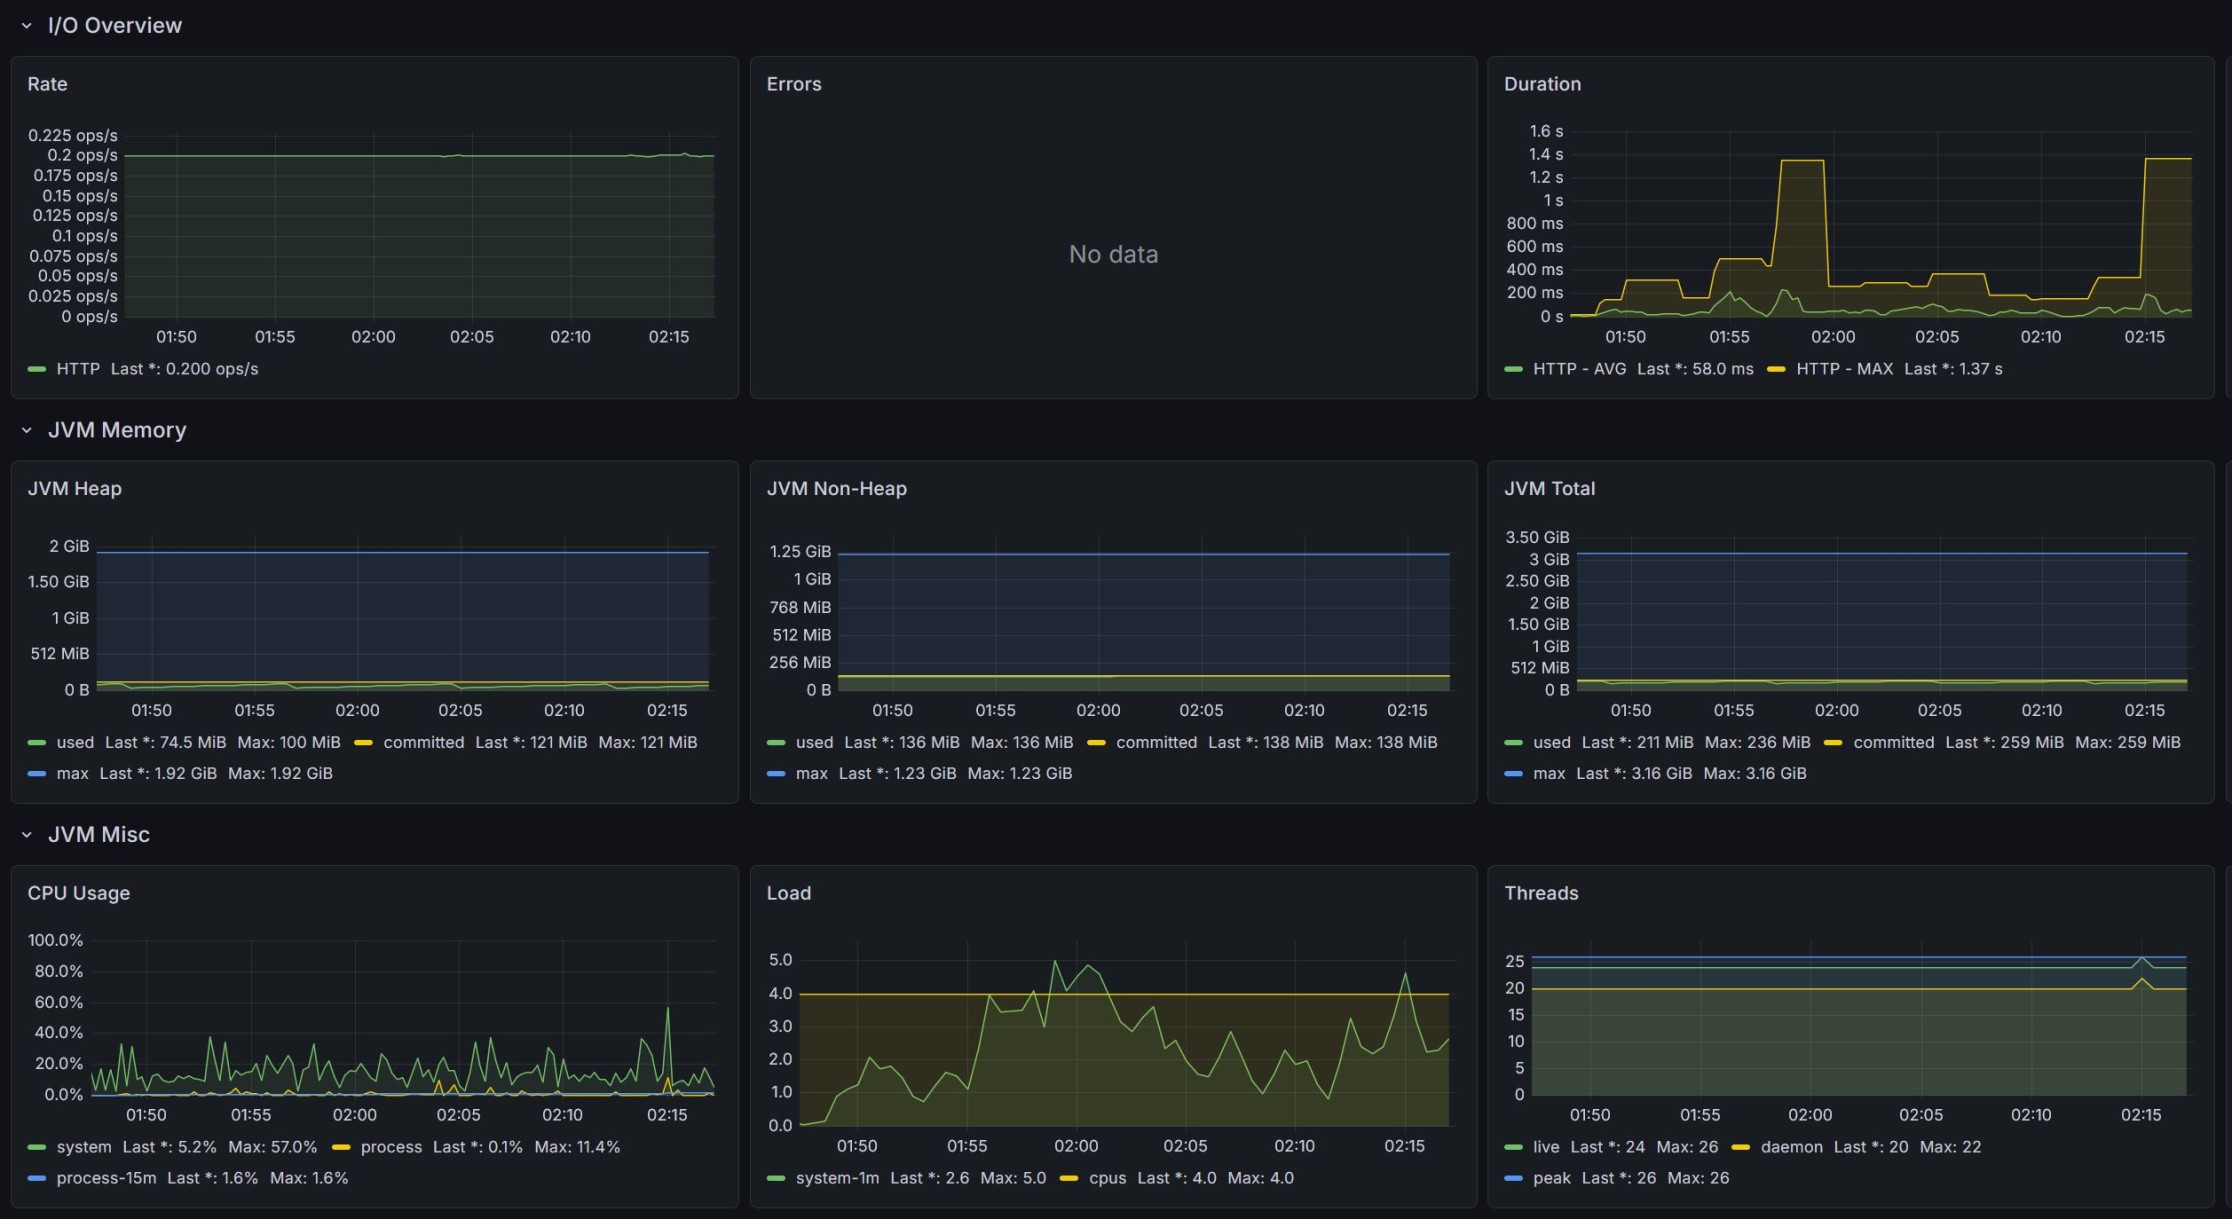
The dashboard will appear, but it may show “No data” initially. Look for the Application dropdown at the top of the dashboard and select petclinic. Then, if there’s an Instance dropdown, pick your petclinic instance (it will look like petclinic:8080). The panels will immediately fill with JVM memory, HTTP request rates, thread states, and more.
Grafana
Visit the PetClinic UI and click through a few pages : owners, vets, visits. Then refresh the Grafana dashboard. You’ll see live metrics updating in real time.
Congratulations!
You've completed the journey from a plain Spring Boot app to a fully observable system – and you did it in under an hour. What makes this approach so powerful is how seamlessly the pieces fit together.
- Micrometer automatically instruments your application’s HTTP layer, JVM, and database connection pools without a single line of custom code.
- Prometheus scrapes those metrics and stores them reliably as time‑series data.
- Grafana turns raw numbers into dashboards that give you instant insight into what your application is doing.
- And Docker glues everything together, letting you spin up the entire stack with one command, whether you're developing locally or deploying to the cloud.
This stack is production‑ready, open‑source, and used by thousands of companies to monitor real‑world applications.
What’s Next?
You now have a solid observability foundation. Here are a few ways to go further:
- Add custom business metrics. Use Micrometer’s MeterRegistry to track domain‑specific data: for example, count how many new pets are registered per day, or measure how long it takes to process a visit. These metrics appear alongside the built‑in ones, giving you complete visibility.
- Set up alerting. In Grafana, you can define alerts that notify you (via Teams, email, ...) when something goes wrong. For instance, when the HTTP error rate exceeds 5% or when JVM memory usage climbs too high. Proactive alerts mean you fix issues before your users notice them.
- Expand to logs and traces. The observability stack is not limited to metrics. Add Loki for log aggregation and Tempo for distributed tracing, both integrate seamlessly with Grafana. Together with Prometheus (metrics), you can build the LGTM stack, a complete observability platform all under one roof in Grafana.
If you have questions or want to share how you’re using observability in your own work, drop a comment below. I’d love to hear about it.
Comments
Leave a comment